- 注册
- 2006-06-05
- 消息
- 5,693
- 荣誉分数
- 1,410
- 声望点数
- 373
这篇普查显示在美国51个州,要成为顶级家庭年收入(即top1%的家庭)所需金额。俺比了一下,CT州最高:64万美元 和NY 州51万美元。而Idaho (ID)州最低,才27.4万美元。最底下的表是各州家庭年收入的中位值(即中间值)。谁有加拿大的数据,可以比较一下。
***
Here's How Much You Need To Make To Be In The Top 1% In Your State (ZT)

The nature of income inequality in the US and elsewhere is one of the biggest questions in contemporary economics and politics, with the Occupy Wall Street movement popularizing the division between the top 1% and the remaining 99% of earners.
Using 2012 American Community Survey household income data from the Minnesota Population Center's IPUMS dataset, we estimated what income a household would need to earn (rounded to the nearest thousand) in order to be in the top 1% of the income distribution in each state:
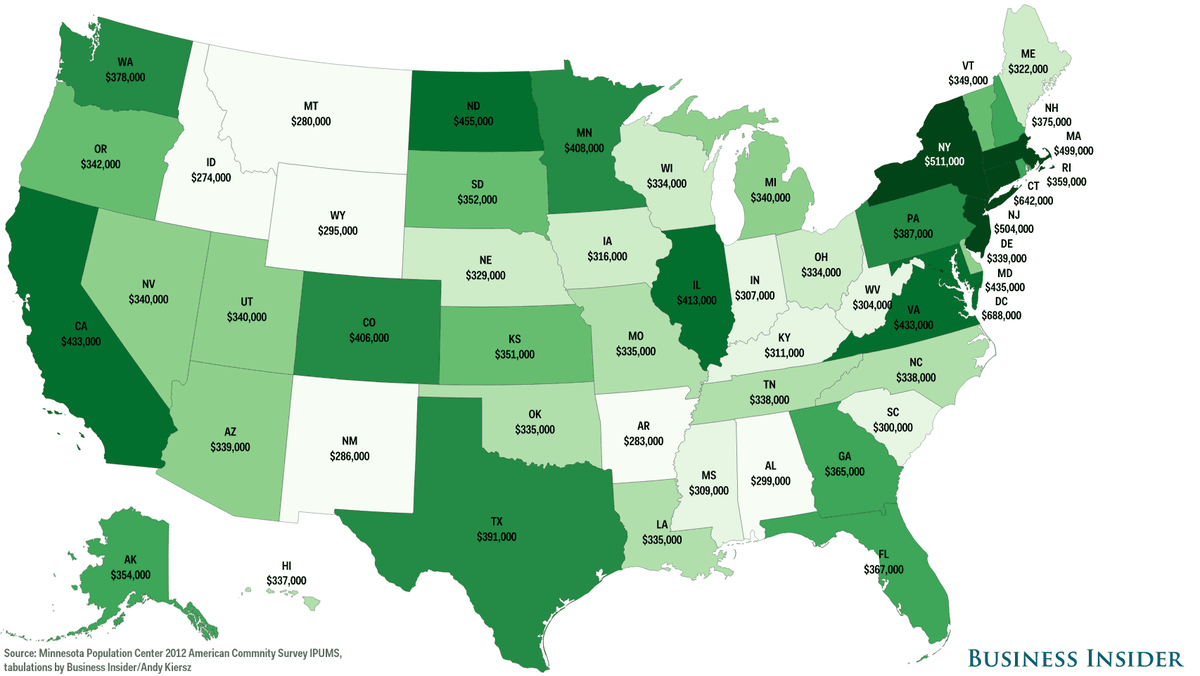 Business Insider/Andy Kiersz, data from Minnesota Population Center 2012 American Community Survey IPUMS
There's a divergence across the country in what it takes to be in the 1%. In the Northeast, top-level incomes are in the area of a half million dollars, while in parts of the South and West, the cutoff is much lower.
These figures should be interpreted as being very rough estimates. Surveys like the ACS frequently have difficulties in capturing the true nature of the very top of the income spectrum. Recent research based on income tax records, like this remarkable slideshow by Berkeley economists Emmanuel Saez and Gabriel Zucman, can give us much more detailed insight into what's going on with the super-rich.
If you want to know if you're in the top or bottom half of your state, here are 2012 median incomes, per the Census Bureau's 2012 ACS estimates:
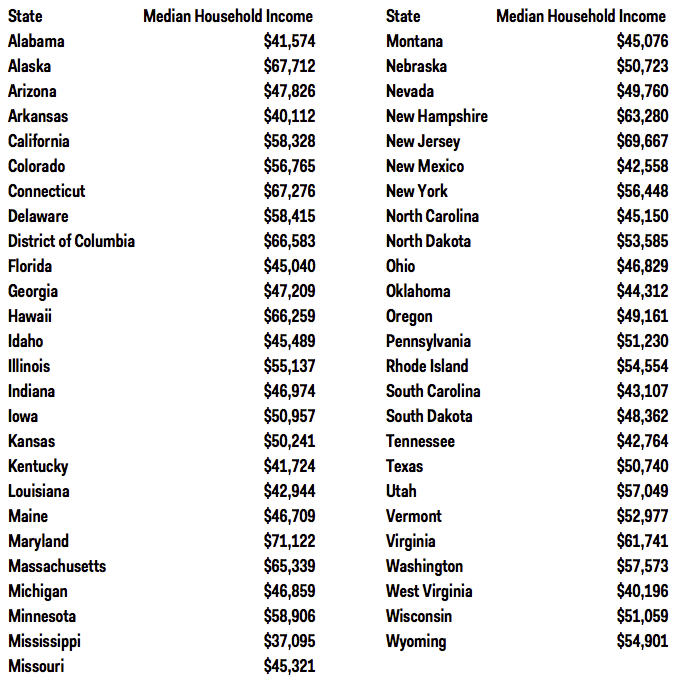 Business Insider/Andy Kiersz, data from 2012 American Community Survey
***
Here's How Much You Need To Make To Be In The Top 1% In Your State (ZT)
The nature of income inequality in the US and elsewhere is one of the biggest questions in contemporary economics and politics, with the Occupy Wall Street movement popularizing the division between the top 1% and the remaining 99% of earners.
Using 2012 American Community Survey household income data from the Minnesota Population Center's IPUMS dataset, we estimated what income a household would need to earn (rounded to the nearest thousand) in order to be in the top 1% of the income distribution in each state:
 Business Insider/Andy Kiersz, data from Minnesota Population Center 2012 American Community Survey IPUMS
There's a divergence across the country in what it takes to be in the 1%. In the Northeast, top-level incomes are in the area of a half million dollars, while in parts of the South and West, the cutoff is much lower.
These figures should be interpreted as being very rough estimates. Surveys like the ACS frequently have difficulties in capturing the true nature of the very top of the income spectrum. Recent research based on income tax records, like this remarkable slideshow by Berkeley economists Emmanuel Saez and Gabriel Zucman, can give us much more detailed insight into what's going on with the super-rich.
If you want to know if you're in the top or bottom half of your state, here are 2012 median incomes, per the Census Bureau's 2012 ACS estimates:
最后编辑:
 明明中等收入的表,打回重写。
 没看全
没看全


